

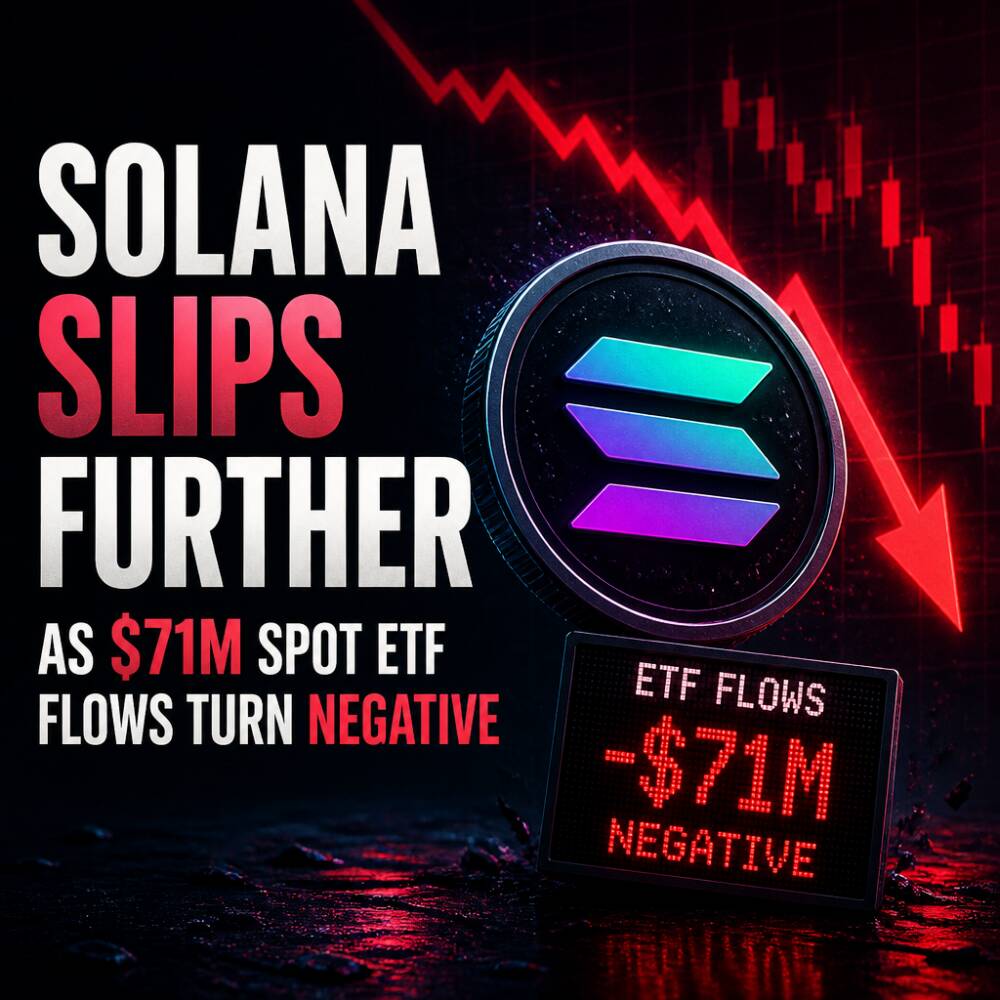
Solana’s token price remained under pressure on Monday, holding near $94.32 and extending its weekly slide to five straight weeks. The move reflects a combination of weakening institutional demand—evidenced by outflows from U.S. spot Solana exchange-traded funds—and a technical setup that continues to favor sellers.
Key takeaways
- Price move: Solana (SOL) traded around $94.32 and stayed on track for a fifth consecutive losing week.
- Catalyst: Data cited by SoSoValue showed U.S. spot SOL ETFs posted $71.47 million in net outflows last week.
- Market implication: Four consecutive weeks of withdrawals suggest institutions have not yet stabilized their exposure to SOL.
- Technical read-through: SOL remains below multiple key moving averages, with momentum indicators still pointing to bearish control.
What drove the move
Institutional flows appear to be a central factor behind SOL’s lack of recovery. According to SoSoValue, U.S. spot Solana ETFs recorded $71.47 million in net outflows last week, which the report described as the largest weekly withdrawal since the products began trading.
The persistence of outflows matters for market participants because ETF demand is often treated as a real-time proxy for regulated institutional interest. SoSoValue data also indicates the selling has continued for four consecutive weeks, raising concerns that the recent weakness is not confined to a single week of profit-taking.
In parallel, on-chain and market-structure signals referenced in CryptoQuant’s summary suggested a more cautious posture from larger participants. The report flagged increasing sell-side dominance in both spot and futures markets, alongside large whale orders that can amplify short-term price swings when liquidity thins.
Market reaction and technical signals
With SOL trading below several widely watched trend measures, buyers have struggled to defend the market’s short-term direction. The article cited the token sitting under its 50-day exponential moving average at $103.81, its 100-day EMA at $99.96, and its 200-day EMA at $98.08. Remaining below all three suggests that any bounce attempt has not yet regained control over the broader trend.
Beyond the moving averages, SOL also sits under a previously identified horizontal resistance level at $97.76. The technical picture implies that rallies may face supply near that area unless ETF demand improves.
Momentum indicators further support the bearish bias, although they point to oversold conditions rather than an immediate reversal. The daily relative strength index was described as hovering near 28, within oversold territory. Meanwhile, the moving average convergence divergence remained in negative territory despite showing a modest improvement, indicating that downside momentum has not fully dissipated.
What investors may watch next
Traders looking for a turning point likely focus on whether SOL can reclaim nearby resistance. The report said buyers would need to overcome $97.76 first; a sustained move above that level could set up a retest of the 200-day EMA at $98.08, followed by the 100-day EMA at $99.96. The $100 level was also flagged as a potential battleground between demand and selling pressure.
If SOL extends higher, attention would shift to the 50-day EMA at $103.81, which the article described as a stronger resistance zone. It also noted a further horizontal reference around $122.76, though reaching that area would likely require a more decisive rebound and improved participation.
On the downside, the initial support referenced in the report is around $88.42 near a broken ascending trendline. A failure to hold that level could expose SOL to the next horizontal support at $78.35. The report cautioned that a move toward $78.35 would represent a substantial decline from current levels, further weakening SOL’s broader technical structure.
Bigger picture
For SOL, the near-term risk appears tied to the interaction between institutional flows and trend-following technical levels. Continued ETF outflows can suppress demand during market dips, while persistent weakness below key moving averages can encourage systematic selling. A turnaround would likely require both improved ETF flow dynamics and a technical reclaim of the levels highlighted in the report.
Investors may also watch upcoming catalysts that can influence broader risk appetite for crypto assets, including macro data releases and central bank messaging. In the immediate term, attention is likely to stay on whether ETF outflows persist and whether SOL can regain the key resistance area around $97.76 without renewed sell pressure.


