

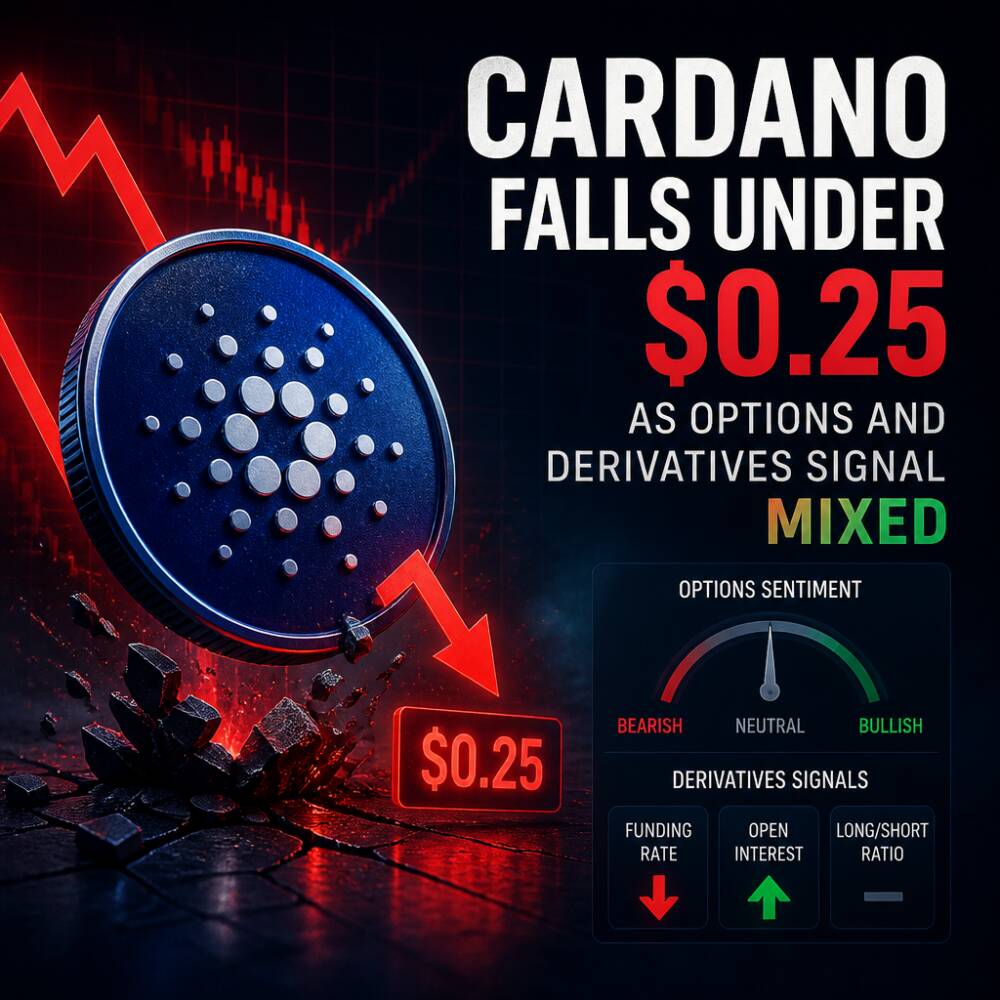
Cardano shares held steady on Monday after a strong prior week, with the token trading below $0.250 as traders weighed conflicting signals from derivatives positioning and on-chain activity. Data cited by CoinGlass showed a cautious bias among some futures traders, while funding rates turned positive—an unusual combination that leaves the next direction less clear despite the still-constructive technical setup.
According to the pricing and technical levels referenced in the report, ADA changed hands around $0.245 after gaining more than 11% over the previous week. While buyers have kept the token above several key moving averages, analysts say the mixed positioning and signs of “overheating” raise the odds of a near-term test of support rather than an uninterrupted continuation higher.
Key takeaways
- Price move: Cardano eased to around $0.245, trading below $0.250 after a weekly advance of more than 11%.
- Catalyst: Derivatives data from CoinGlass showed a long-to-short ratio near multi-week lows alongside a positive funding rate.
- Technical implication: ADA remained above multiple moving averages, but the next downside checkpoints include the 200-day EMA area near $0.239 and a horizontal support zone around $0.236.
- Market read-through: On-chain and market-rate indicators flagged sell-side dominance and overheating, suggesting supply could increase if ADA attempts to extend the rally.
What drove the mixed signals in derivatives
According to CoinGlass data, Cardano’s long-to-short ratio stood at 0.73 on Monday, close to its lowest level in more than a month. In futures markets, a reading below one generally implies that short positions outnumber long positions, a setup often associated with caution or a bearish tilt among leveraged traders.
Funding rates, however, pointed in the opposite direction. The report said Cardano’s funding rate turned positive on September 17 and was at 0.0049% on Monday. When funding is positive, long position holders typically pay short position holders, which can indicate demand for leveraged upside exposure.
Together, the two metrics portray disagreement rather than consensus. After an 11% weekly gain, the token can attract both momentum-driven longs and traders looking for a corrective pullback. The report argued that ADA’s next sustained move may hinge on whether fresh buying meaningfully offsets profit-taking and any further increase in short positions.
On-chain indicators point to potential supply pressure
CryptoQuant’s summary data, as cited in the report, added another layer of uncertainty. The platform’s futures-market indicators reportedly showed large orders associated with “whales,” along with sell-side dominance and signs of overheating after ADA’s recent rise.
Large orders can significantly influence short-term price action, but the report cautioned that their presence alone does not clarify the direction of the next move. Instead, the combination of sell-side dominance and overheating suggests traders should watch whether additional supply appears as ADA tries to push higher.
CryptoQuant also flagged overheating in spot markets, while other readings were described as neutral. The overall takeaway from the mixed dashboard was described as mildly cautious, without broad confirmation across all indicators.
For investors focused on near-term market structure, the key implication is whether buyers can absorb any selling around current ranges. The report suggested that if support holds during consolidation, the prior rally could remain intact; otherwise, the pullback could deepen.
Technical picture stays constructive, but key levels are close
The report characterized Cardano’s technical posture as constructive, even with Monday’s dip. At about $0.2452, ADA was said to be above its 50-day exponential moving average (EMA) near $0.215, its 100-day EMA around $0.209, and its 200-day EMA near $0.239. It was also described as above a horizontal support level around $0.236.
Momentum indicators were also portrayed as supportive. The report cited the relative strength index (RSI) near 60 and a positive moving average convergence divergence (MACD) line. While those measures typically align with ongoing bullish momentum, the report emphasized they are not guarantees against a pullback—especially when derivatives positioning and on-chain activity are mixed.
On the downside, the first major level mentioned was the 200-day EMA near $0.239, followed by horizontal support at $0.236. If selling pushes through both, attention would shift to the 50-day EMA near $0.215 and the 100-day EMA near $0.209. The report also cited further support areas around $0.197 and, at a more distant level, $0.150.
On the upside, the next significant resistance was identified near $0.299. Reaching it would likely require ADA to restart its climb from the current consolidation below $0.250.
What to watch next
With ADA trading below $0.250 and signals split between technical strength and cautious positioning, investors may want to monitor whether the token holds above the 200-day EMA region near $0.239 and the nearby horizontal support around $0.236. The next direction could become clearer as futures positioning evolves and as market demand absorbs— or fails to absorb—any sell-side pressure highlighted by on-chain indicators. For further guidance, upcoming price reaction around these levels and any subsequent catalyst that changes derivatives sentiment will be key.


