

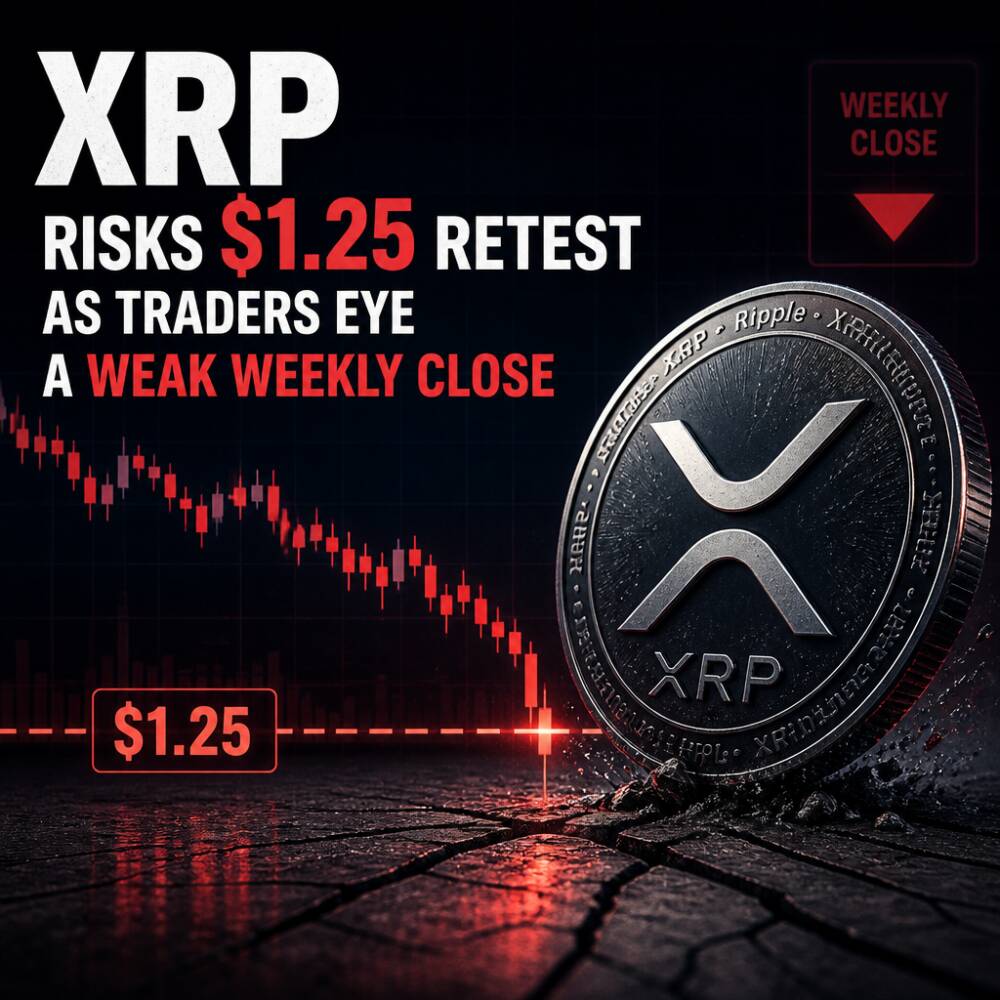
XRP traded around $1.40 on Monday after a pullback from roughly $1.66 in late September, with the token briefly touching $1.32 last week. The rebound has so far held off a confirmed breakdown, but analysts say the chart remains vulnerable, with a narrow support zone near $1.35 to $1.38 becoming the next key test.
Market participants are watching closely for a decisive daily close below that area, which could shift the move from a routine correction to a deeper technical breakdown. With momentum indicators remaining weak and leveraged long positioning reportedly crowded, the downside risk is tied largely to whether buyers can defend the level.
Key takeaways
- Price move: XRP hovered near $1.40 Monday after dipping to about $1.32 and falling from the late-September peak near $1.66.
- Catalyst: Traders are reacting to a fragile technical structure centered on support at roughly $1.35 to $1.38.
- Key implication: A daily close below $1.35 to $1.38 could reopen downside toward $1.30 and potentially keep a $1.25 scenario on the table.
- What to watch: Momentum and moving-average signals are still skewed bearish unless XRP can reclaim key resistance around $1.40.
What drove the move
Technical analysts pointed to a cluster of overlapping moving averages and support levels that make Monday’s price action unusually sensitive to follow-through. FXStreet analyst John Isige said XRP’s short-term outlook remains tilted lower unless buyers can secure a convincing close back above $1.40.
FXStreet also cited moving-average reference points near the current range, including the 50-day exponential moving average around $1.40, the 200-day EMA near $1.38, and the 100-day EMA around $1.34. That concentration suggests the market is in a narrow decision window: holding above the zone may stabilize the chart, while losing it could quickly impair multiple technical “floors” at once.
Additional indicators remain under pressure. Data compiled by Investing.com late Monday reportedly classified XRP as a “Strong Sell,” noting bearish readings in the relative strength index and sell signals across several major moving averages.
Market reaction and positioning risk
The concern for traders is not just the level itself, but the potential for downside acceleration if support fails. Losing $1.35 could matter because it would remove several technical cushions that appear to be clustered in the same band.
Positioning data also raises the risk profile. According to Bitrue Research Institute data cited by Yahoo Finance, XRP’s long-to-short ratio stood near 2.32 on Monday—implying that leveraged bullish positions outnumbered shorts by more than two to one. Crowded longs are not always bearish, but they can amplify losses if price breaks support and triggers stop-losses or liquidations.
There is a counterweight, however. The article noted that whale exchange activity appeared subdued, suggesting large holders were not aggressively dumping. That could support stabilization if buyers continue to defend the current range, particularly around the $1.35 to $1.38 band.
Downside scenarios and ETF inflows
While $1.25 remains a lower-probability scenario rather than a confirmed target, some analysts highlighted it as a level where bearish momentum could intensify. Technical analyst Egrag Crypto reportedly sees XRP consolidating broadly between $1.30 and $1.45, with $1.25 identified as a potential breakdown point. CryptoFrontNews also suggested that losing $1.25 could expose the $1.18 to $1.20 region.
At the same time, institutional demand is not collapsing. The report said US spot XRP exchange-traded funds attracted $11.31 million in net inflows last week, even as XRP sold off sharply, with Bitwise accounting for $10.55 million of that total. That type of sustained inflow can sometimes reduce selling pressure, though it does not necessarily prevent technical breakdowns if the broader market turns.
Importantly, the article stated that XRP had slipped below the $1.35 to $1.38 support zone on a daily closing basis, increasing pressure on the technical outlook. If bulls do not quickly reclaim the zone, the next support to watch becomes $1.30, followed by the potential for $1.25 to re-enter focus on further weakness.
Bigger picture: what traders will track next
For now, the near-term direction hinges on whether XRP can regain confidence above $1.35 to $1.38 and whether it can push toward resistance around $1.40. With moving-average signals and momentum readings reportedly still bearish, traders appear focused on confirmation—either a renewed hold above the support band or another close that turns the move into a more structural decline.
Beyond the chart, investors will likely watch continued flow data from spot XRP ETFs and any changes in large-holder behavior. The next key timing for the setup is the next daily close around the $1.35 to $1.38 zone, which could determine whether the market stays in consolidation or begins to test deeper levels.


