

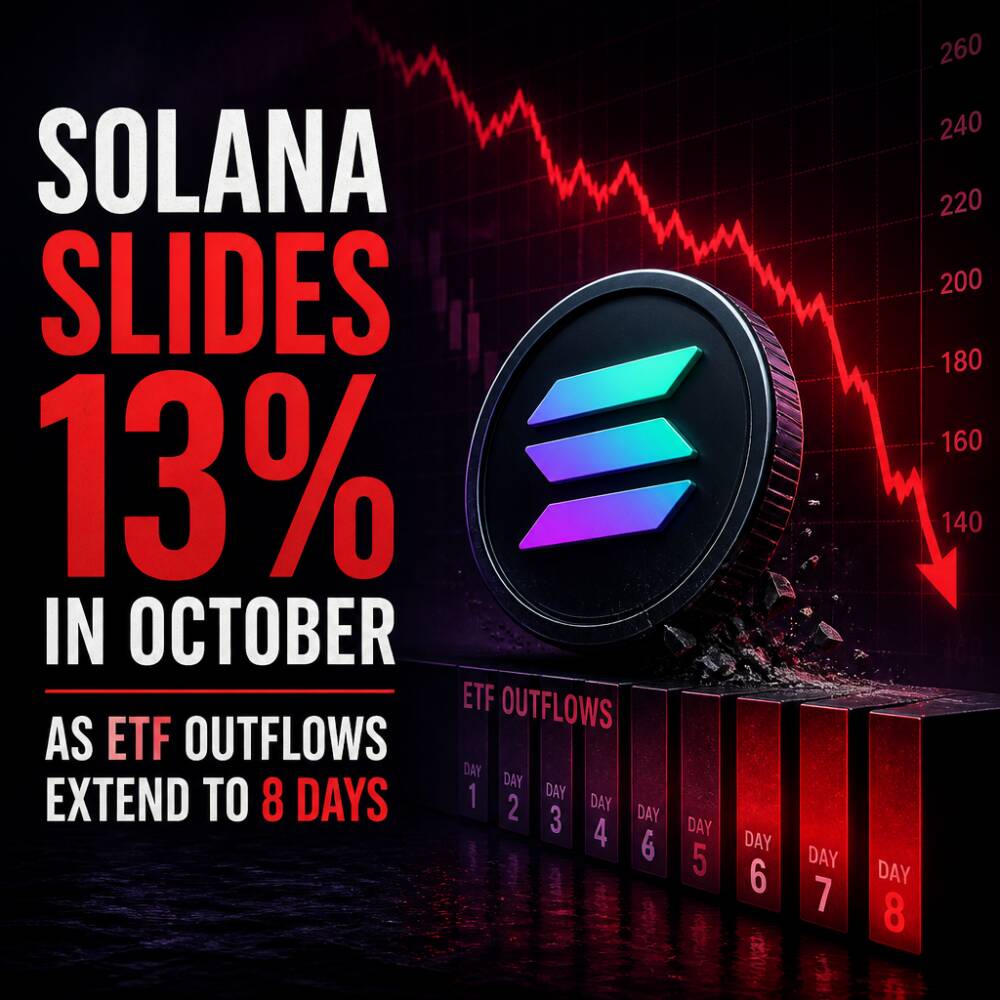
Solana extended its downturn on Thursday, edging close to the $100 level as steady outflows from Solana-linked exchange-traded funds and soft technical momentum weighed on sentiment. SOL was trading around $101.82 at the time of the report, after sliding about 2% on Wednesday following a failure to break through resistance near its 50-day exponential moving average at $107.13.
The latest move follows a double-top reversal near $122 in early October, leaving the token down more than 13% for the month and increasing the likelihood that near-term support will be tested. While activity in parts of Solana’s on-chain tokenized markets has continued to expand, it has not yet translated into immediate price support for SOL.
Key takeaways
- SOL neared $100 after weakening again on Thursday, with the token down more than 13% in October.
- ETFs were the main headwind, with persistent redemptions keeping pressure on demand via regulated products.
- Key levels are in focus, particularly the $100 area and the 200-day EMA near $97.95.
- On-chain tokenization continued to grow, but broader selling pressure still dominated SOL’s near-term trading.
- Rebound odds hinge on defense of support; a breakdown would raise the risk of deeper losses.
What drove the move
Solana-focused ETFs extended their streak of net outflows to eight consecutive trading days. According to CoinGlass data, the funds recorded $1.30 million in net outflows on Wednesday, following $24.81 million of outflows reported earlier last week. For market participants, sustained redemptions are often viewed as removing a potential source of incremental demand at a time when price momentum is already deteriorating.
At the same time, tokenized equity activity on Solana continued to expand, offering a counterpoint to the bearish price action. Blockworks data showed tokenized equity supply on the network reached nearly $611 million on Tuesday, spread across roughly 1.42 million holders. Investors may interpret that growth as evidence of ongoing infrastructure adoption, but it does not necessarily translate into immediate buying pressure for SOL, especially when ETF flows are negative and technical indicators remain weak.
Market reaction and technical picture
From a chart perspective, the daily outlook remains bearish. The report tied the shift to the early-October double-top reversal near $122 and a subsequent move below the 50-day EMA. Momentum indicators also point to caution: the Moving Average Convergence Divergence indicator was described as trading beneath both its signal line and the zero line, consistent with negative momentum.
The Relative Strength Index was near 35, suggesting sellers still retain control, though the reading remains above the commonly referenced oversold threshold of 30. That combination often implies downside pressure can persist without the market yet signaling a clear “washed out” condition.
Support levels are now the focus. SOL is still trading above its 200-day EMA at $97.95, which—if held—could keep the decline framed as a correction rather than a deeper trend break. A decisive loss of that longer-term average would weaken that interpretation and raise the risk of further selling.
In the near term, the $100 area stands out as the immediate psychological level. If $100 fails to hold, the report highlighted the 200-day EMA near $97.95 as the next technical benchmark. A clear break below $97.95 could open the door to a move toward the May 17 high near $83.50, depending on whether sellers sustain the breakdown.
On the upside, the first major barrier remains the 50-day EMA around $107.13, where the latest recovery attempt stalled. A sustained move back above that level would likely be needed to ease near-term selling pressure. Beyond it, resistance levels cited in the report include the September 25 high at $122.94.
What to watch next
With ETF withdrawals still negative and momentum indicators not yet improving, the immediate question for SOL is whether buyers can defend the $100–$97.95 zone. Investors may also watch for signs that ETF outflows are stabilizing, as a return to consistent inflows would better align regulated-product demand with any technical recovery attempt.
Beyond token-specific drivers, the next catalysts to monitor would include broader crypto market risk appetite, developments in ETF flows, and follow-through versus the highlighted moving averages at $107.13 and $97.95. As long as redemptions persist and momentum stays weak, traders will likely treat any bounce attempt as vulnerable unless support holds.


