

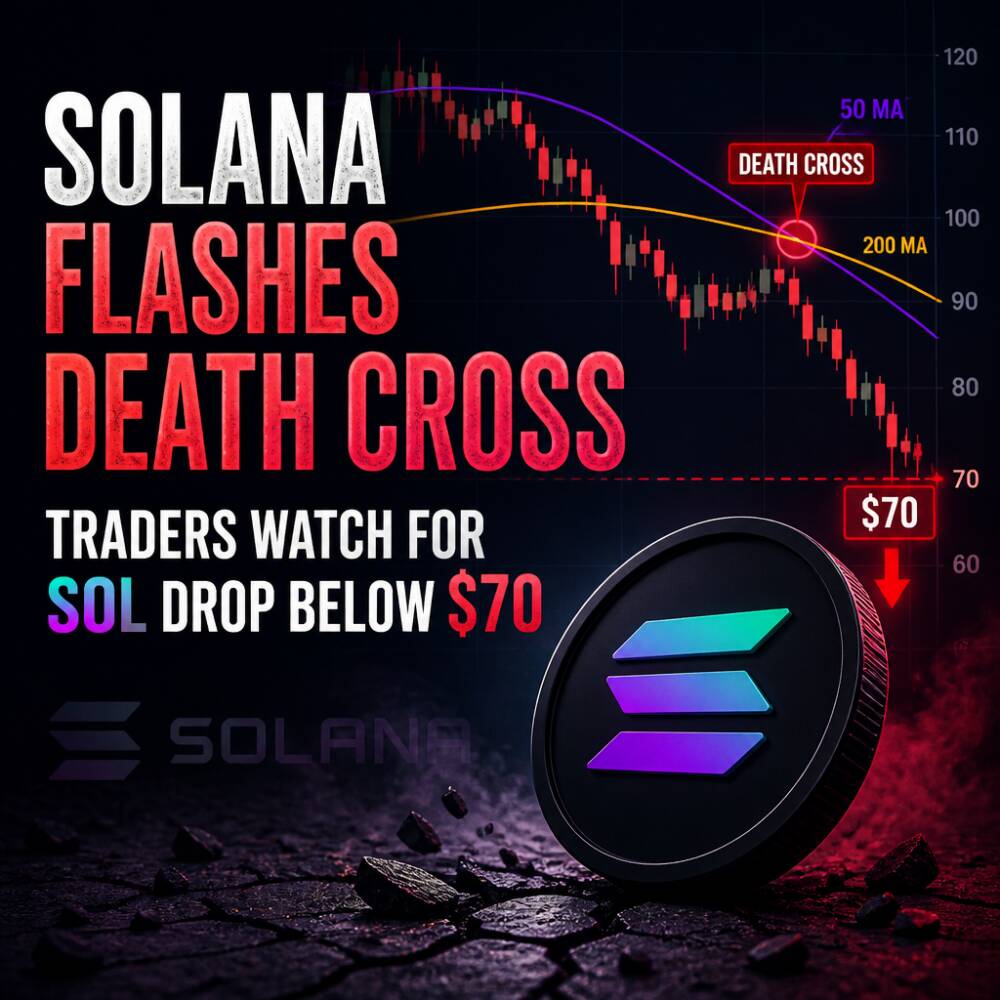
Solana extended its slide on Friday, falling 3.5% to trade around $80.54 after the broader cryptocurrency complex sold off and briefly pushed prices below the $80 mark. The move added to losses of roughly 10% since the start of the week, continuing a correction that began after Solana traded above $120 in early October.
Pressure intensified as Bitcoin dropped below $70,000, a move that triggered margin liquidations across crypto derivatives and spilled over into higher-beta assets like Solana.
Key takeaways
- Price move: Solana slipped about 3.5% to around $80.54, extending a weekly decline of roughly 10%.
- Catalyst: Bitcoin’s drop below $70,000 helped drive a fresh wave of leveraged liquidations in crypto derivatives.
- Market implication: Solana’s weakening technicals—highlighted by a “death cross” and deteriorating momentum—point to further downside risk if selling persists.
- Positioning signal: Open interest in Solana futures fell, while indicators suggest bearish pressure remains dominant in the near term.
What drove the move
Friday’s decline followed broad risk-off behavior in crypto markets after Bitcoin moved below $70,000. Data cited from CoinGlass showed approximately $1.64 billion in leveraged cryptocurrency positions were liquidated over the past 24 hours, reinforcing the idea that forced selling played a role in dragging prices lower.
CoinGlass data also indicated that long positions accounted for $1.43 billion of the total liquidations, suggesting the sell-off punished traders positioned for price gains.
Solana’s own derivatives activity showed signs of thinning demand. CoinGlass reported that Solana futures open interest fell 6.3% over the last 24 hours, bringing it to $4.82 billion. Separately, reported spot outflows were approximately $8.80 million, aligning with a cautious stance among market participants.
Market reaction and positioning
Beyond the liquidation figure, positioning indicators highlighted continuing bearish control. The SOL taker buy-to-sell ratio was around 0.91, remaining below 1 since late July—an imbalance that implies sell activity has been outpacing buying activity.
In addition, analysts tracking correlations between crypto and equity market moves have noted recent sensitivity of digital assets to technology-related headlines. The article cited weakness in technology stocks following Nvidia CEO Jensen Huang’s resignation amid scrutiny over personal relationships, while also pointing to broader links between crypto price action and artificial intelligence-related equity moves.
Technical picture: death cross raises downside risk
Technical signals deteriorated further as Solana slid away from key moving averages. Coincident with Friday’s trading around $80.54, Solana sat well below two major trend gauges: the 50-day exponential moving average at $97.55 and the 200-day exponential moving average near $98.62.
CoinGlass-linked market coverage described a bearish “death cross,” where the 50-day EMA has crossed below the 200-day EMA. In typical technical analysis frameworks, that crossover reflects weakening medium-term momentum relative to the longer-term trend.
Solana also broke below a previously supportive ascending trendline around $91.20. That breakdown can reduce confidence in a near-term rebound, with the former support area potentially acting as resistance if prices attempt to recover.
Momentum indicators reinforce the bearish tone. The daily Relative Strength Index (RSI) was around 21, placing Solana in deeply oversold territory (RSI below 30 generally indicates oversold conditions). The Moving Average Convergence Divergence (MACD) remained below zero, with the signal line around -0.81, indicating that bearish momentum is still present.
Levels investors may watch next
With Solana trading near $80, immediate downside support is cited at $77.60. A hold at this level could allow consolidation or a temporary relief move, while a decisive break below it would further weaken the technical outlook. The next larger downside target mentioned was $67.50.
On the upside, the first notable resistance was identified near $87.46. A sustained move above that area would suggest improving short-term buying momentum. Higher resistance was also flagged around $95.82, with the cluster of the 50-day and 200-day EMAs near $97.55 and $98.62 forming a more significant hurdle. A break above that EMA zone would be a clearer signal that bearish momentum is beginning to fade.
For the next catalyst, investors are likely to watch whether Bitcoin can hold above $70,000 and whether Solana’s derivatives positioning stabilizes—particularly open interest trends and the taker buy-to-sell ratio. In the days ahead, further price guidance may also depend on broader market liquidity and upcoming crypto-related macro signals, including U.S. economic data and central bank communications that can sway expectations for rates.


