

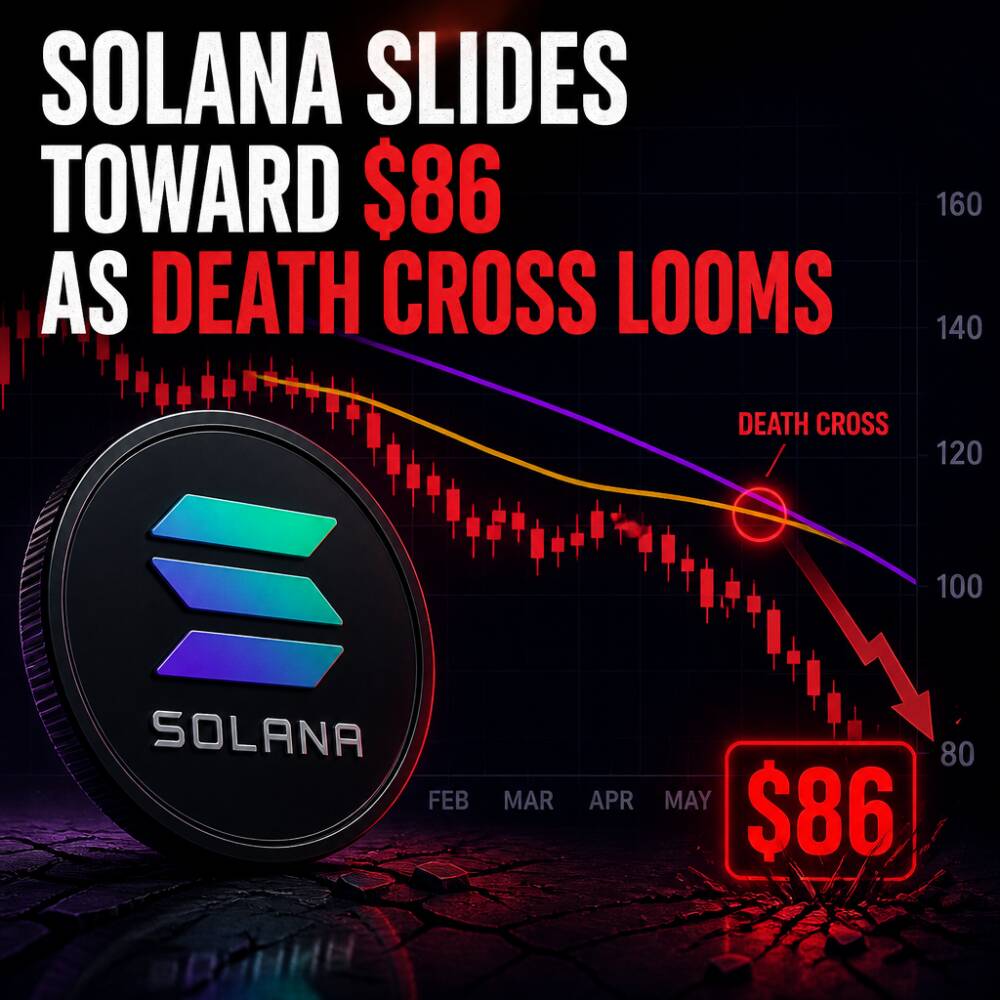
Solana prices hovered around $86.25 on Monday after falling more than 3% over the previous 24 hours, extending a broad risk-off tone for the token. Analysts pointed to weakening institutional demand, a softer derivatives backdrop, and a technical breakdown that has shifted key support levels into potential resistance.
The slide marks a fifth consecutive week of declines for Solana, while data also signals that leveraged traders are cutting exposure rather than adding to upside bets.
Key takeaways
- Price move: Solana traded near $86.25, after a more than 3% daily decline and a five-week losing streak.
- Catalyst: Net outflows from Solana-focused spot exchange-traded funds (ETFs) and deteriorating futures positioning.
- Derivatives shift: Open interest fell to $5.20 billion and long liquidations outweighed shorts, suggesting bullish leverage is being squeezed.
- Technical implication: With Solana below key moving averages, bears are targeting the $77 support area.
ETF outflows signal softer institutional appetite
Institutional flows have remained a headwind for Solana. According to SoSoValue, Solana-focused ETFs recorded nearly $170 million in net outflows over the past five weeks.
The funds pulled $26.25 million in withdrawals last week, extending the negative streak to five consecutive weeks. SoSoValue also reported that October saw a particularly heavy week of selling pressure, with weekly outflows of $71.47 million during the period covered by the same five-week window.
Market participants typically watch ETF flows as a real-time proxy for longer-horizon demand. A return to positive weekly flows could help stabilize sentiment, but continued withdrawals would reinforce concerns that institutional investors are not ready to add risk.
Derivatives market points to caution and long exposure being unwound
Derivatives indicators have also turned more defensive. Data cited from CoinGlass showed Solana futures open interest declining to $5.20 billion on Monday—its lowest level since August 19. CoinGlass data further indicates a drop from an October 8 peak of $7.62 billion, implying around $2.42 billion in outstanding futures positions have been closed.
The combination of falling open interest and a declining spot price suggests traders are reducing exposure rather than building new bullish positions. Funding dynamics also align with that view: Solana’s funding rate stood at -0.0033% on Monday, indicating that short-position holders were paying long-position holders in perpetual futures—consistent with stronger demand for bearish exposure.
Liquidation data added to the caution signal. Over the last 24 hours, Solana recorded approximately $39.22 million in long liquidations versus $2.37 million in short liquidations. The imbalance suggests that leveraged longs took the brunt of the move as prices slid.
Technical picture deteriorates as support turns into resistance
Beyond flow and derivatives, the technical structure has weakened after Solana broke below key levels. By Monday’s market, Solana was trading around $86.20 after breaking the $87.80 support level earlier in the session.
Broader context remains negative: Solana declined 8% over the prior week and fell 19% throughout October, reflecting sustained selling pressure across multiple sessions.
Investors are also focusing on trend-following indicators. Solana remains below its 200-day exponential moving average (EMA) at $99.26, a level that now represents a larger overhead barrier. The 50-day EMA, around $100.35, is trending downward toward the 200-day EMA, raising the risk of a bearish “death cross” signal if the moving averages continue to converge.
Momentum readings do not yet point to a durable reversal. The daily relative strength index (RSI) sits near 27, which places Solana in oversold territory. While that can sometimes support short-term rebounds, it does not confirm that the broader correction is finished. The moving average convergence divergence (MACD) remains negative, indicating bearish momentum is still in control.
With $87.80 support broken, the market’s immediate demand zone is now seen around $77.60, described as a key EMA level buyers must defend. A decisive move below that area could accelerate losses toward $70.26, the next notable support level.
What to watch next for Solana
Near-term direction will likely depend on whether derivatives positioning stabilizes and whether spot demand can reclaim broken technical levels. Investors will be watching for evidence of reduced ETF outflows—particularly any shift toward positive weekly flows—as well as confirmation on price action around $90.41, a level highlighted as part of the broken ascending trendline. A sustained move back above key resistance could also improve the odds of a retest of higher moving averages near $95.82 and the 200-day EMA around $99.26.
More broadly, traders may react quickly to macro signals that influence risk assets and to any upcoming updates that could affect cryptocurrency liquidity and institutional participation.


