

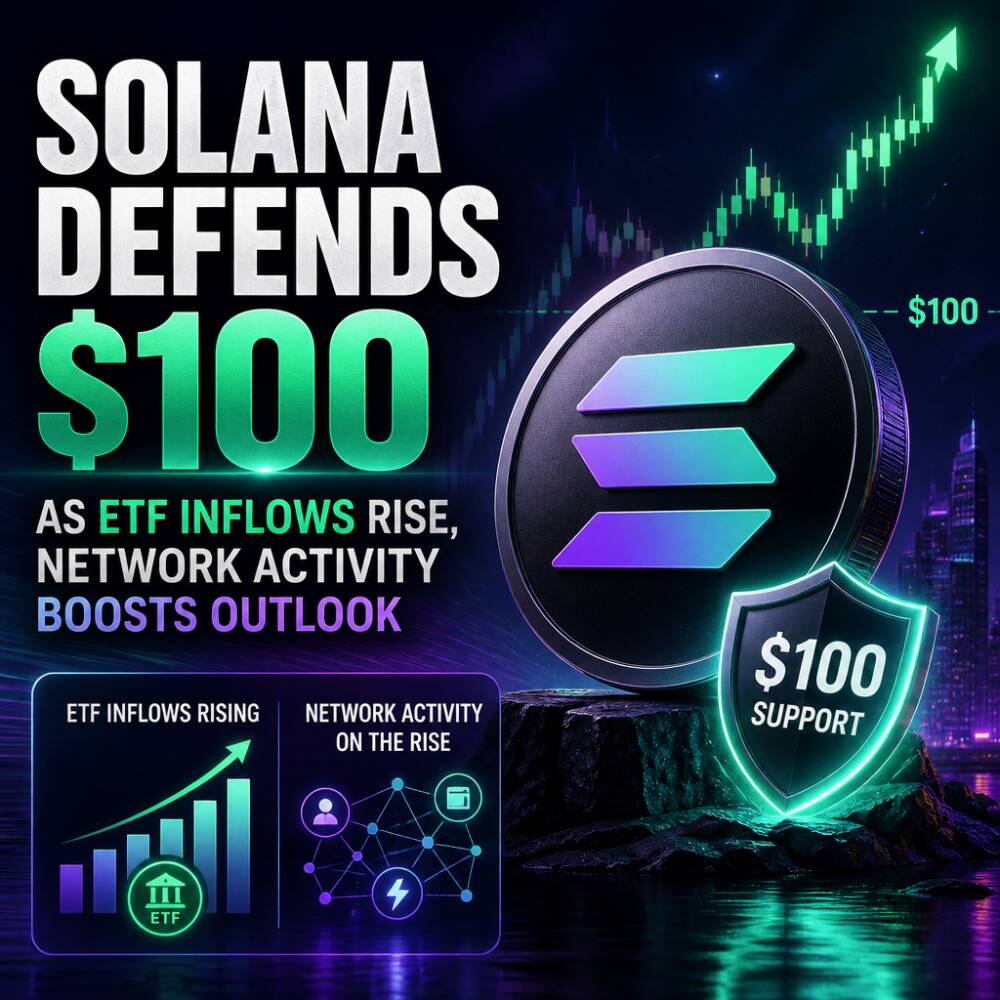
Solana edged lower on Tuesday after starting the week with a roughly 3% gain, with the token consolidating around the $100 level. Despite the near-term softness in price, data points to stronger institutional positioning and improving network activity, leaving traders focused on whether SOL can resolve a tightening chart pattern to the upside.
Key takeaways
- SOL moved modestly lower while holding close to $100 support and trading near key moving averages.
- Catalyst included continued institutional ETF demand and a recent Solana Transaction V1 upgrade that expands transaction capacity.
- Underlying implication: improving network revenue and transaction counts support a constructive medium-term thesis, even as SOL’s chart setup waits for confirmation.
- Investor watchpoint: a clean break above nearby resistance levels would improve the odds of follow-through toward higher technical targets.
What drove the market focus on Solana
Solana’s fundamentals have been gaining support as infrastructure upgrades and usage metrics move in the right direction, even as the market keeps SOL largely range-bound around $100.
One notable driver is Solana’s recently activated SIMD-0385 upgrade, which introduced a Transaction V1 format. According to the upgrade description cited in coverage, the maximum transaction size increases to 4,096 bytes, giving developers more room to include additional instructions and data within a single transaction rather than splitting functionality across multiple transactions.
The Solana Foundation’s technology vice president, Jacob Creech, said in a post referenced by the report that the update could support zero-knowledge privacy features and more complex transaction routing. While that speaks to longer-term product possibilities, the practical near-term effect is broader capacity for application developers building on Solana.
Network activity also showed signs of strength. According to Blockworks data cited in the article, Solana generated $45.35 million in network revenue last week, up from $32 million the week before. The report also said “real economic value,” which includes transaction fees and out-of-protocol tips, rose to $6.33 million from $5.36 million. Transaction activity climbed to 1.07 million from 966,862 a week earlier—signals that demand for Solana blockspace has strengthened.
ETF inflows keep institutional momentum intact
While spot price action remained subdued, institutional flows were a key counterweight for sentiment. According to the report, spot Solana exchange-traded funds recorded $11.01 million in net inflows on Monday, exceeding $10.30 million accumulated during the prior week.
The article said the latest result extended Solana’s run to 11 consecutive weeks of ETF inflows. It also cited that the products brought in $14.62 million in July and that inflows accelerated to $193.54 million in August.
For investors, the combination of steady ETF demand and a consolidation near a widely watched price level can matter as it often reduces the odds that weakness is purely technical. However, ETF buying does not remove timing risk for a token still trading within a chart-defined range.
Speculation returns, supported by Pump.fun activity
The report also linked Solana’s improving on-chain environment to a resurgence in speculative activity within its memecoin ecosystem. It pointed to Pump.fun, describing it as one of Solana’s largest token-launch platforms.
According to the figures cited, Pump.fun recorded approximately 34,184 new token launches on September 10. The article said Pump.fun accounted for roughly 85% of all launches across Solana launchpads tracked that day, highlighting renewed appetite for newly created tokens.
As speculative liquidity returns, the network can see higher transaction throughput and additional fee generation. The report added that Pump.fun’s gross protocol revenue during the third quarter so far totals approximately $89 million, citing DefiLlama. It said that amount already surpasses roughly $79 million generated across the entirety of the second quarter, implying that the recovery is not confined to launch counts but is also translating into paid usage on the platform.
Market reaction: SOL’s technical setup near $101
On the chart, the report described SOL forming a symmetrical triangle as price action narrows between converging trendlines. It said SOL traded around $101 on Tuesday, remaining close to a 50-period EMA at $101.72 and slightly above a 100-period EMA at $100.71 on the four-hour chart. The token was also described as comfortably above a 200-period EMA at $96.06, preserving the short-term constructive structure.
Near-term support was also associated with the 78.6% Fibonacci retracement level at $101.51. Momentum signals were described as neutral, with the RSI around 51 and the MACD marginally above its signal line while approaching the zero level, suggesting modest bullish bias rather than a strong trend impulse.
In terms of levels, the article identified immediate resistance near the triangle’s upper trendline around Tuesday’s high of $104.82. It said a breakout could open a retest of a $110.60 swing high. For upside, the report cited a potential activation of a 127.2% Fibonacci extension targeting $123.32, described as nearly 20% upside from current trading levels.
On the downside, it pointed to the $100.71 area around the 100-period EMA as first support, with additional protection near $98 and the $96.06 200-period EMA.
What to watch next
With SOL consolidating around the $100 handle and waiting for a triangle resolution, traders will likely focus on whether price can hold above key moving-average support and break convincingly through resistance near $104.82 and $110.60. Continued ETF inflows and sustained network revenue growth could provide additional support, while any volatility in the memecoin segment—where activity can shift quickly—may affect near-term trading momentum. The next catalyst will be confirmation from technical follow-through and broader market drivers affecting risk appetite.


